

The objective of this project is to see you have an understanding of directional trading and how to use indicators.
Below is chart of Microsoft (MSFT). There are different times over the past 2 years in its trade cycle where it was going up and down.
It is overlayed with candle charts, Bollinger Bands, RSI (Relative Strength Index) and Slow Stochastic.
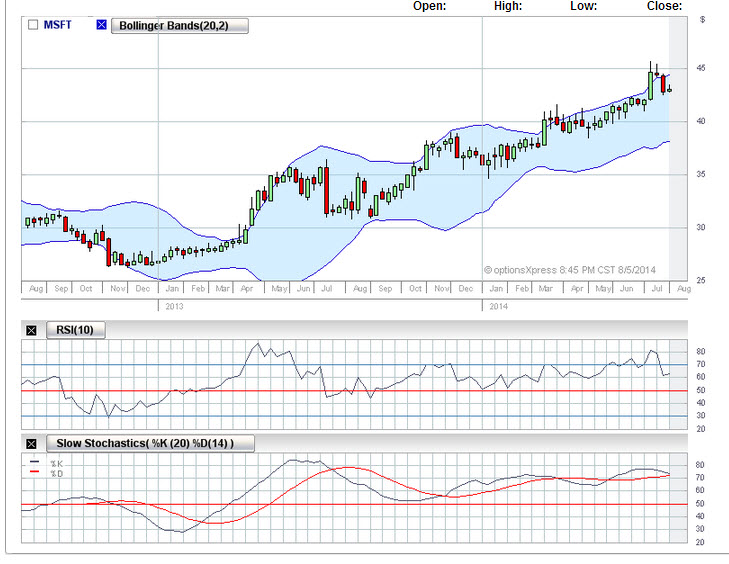
You are to comment and analyse the chart utilising what you have learned in Course 2.
Using a directional approach to trading, do you see entry signals for when the candles were pushing out of the Bollinger Bands, when the RSI was showing it was overbought and / or oversold, and the slow stochastic were showing crossovers of the stock turning?
You are to pick 2 times and explain what a trader would be looking for using the various indicators – Candles, Bollinger bands, RSI (Relative Strength Index) and Slow Schotastic.
Pick in your first analysis when the stock was ready to go up and what indicators were showing this.
In your second analysis pick a time when the stock was ready to go down and what indicators were showing this.
If you have the computer ‘know how’ highlight these times graphically and comment on the candle momentums leading up to that time as shown below. Otherwise make a note in your submission the month and year you are referring to in the chart.
(NOTE: Remember that the indicators are calculated on different mathematical models. Because of this, getting them to all line up precisely can prove to be difficult for a trader. If you find this then note it in your answer.)