

Investing is a funny game. If we could precisely calculate with accuracy the potential risk and loss beforehand then more people would probably sleep better at night. The more knowledge and due diligence performed, the more skilled investors become in determining this.
However, we have to recognise there are certain things in life we are in control of and there are a lot of things that are beyond our power.
 Wise farmers diversify their flocks and crops as they don’t know what crop will be bumper and which will be scarce. Seasonal factors are all beyond their control.
As mentioned in the previous class on margin, with options, to a large extent you can mathematically calculate how much maximum profit and loss there is to each trade. This allows a trader to make an informed decision whether the risk vs reward ratio works for them.
Additionally, there are guidelines that can assist you in determining what a premium of an option may or may not be in terms of pricing. There are further tools that can also help you measure the volatility of a stock.
Volatility is a large factor in determining the pricing of an option. Remember there is time value – time left to expiry and intrinsic value. Within that an options premium is often determined by its volatility. Generally speaking the greater the volatility, the greater the premium, as it is directly related to risk.
Think of it like an insurance company. They will charge higher premiums the greater the risk to ensure a certain item. This is why you are often asked with life insurance applications your age (time to expiry), smoker or non-smoker, do you engage in any risky sports or activities, employment (desk job vs stunt man), any previous medical conditions that could adversely affect your health etc. The greater the risk to the insurer, the higher the premium they charge.
DELTA, GAMMA, THETA, VEGA
Delta, gamma, theta, vega are known as ‘The Greeks’.
In short the Greeks are a theoretical measurement that helps determine the price of an option premium. They measure the sensitivity of an option relative, based on mathematical models.
Traders rely on the factual data of bid, ask, last prices, open interest and volume. The Greeks are theoretical measurements used to measure risk and reward as price movements occur. They move according to how close they are to the actual underlying price of the asset and length of time to expiry.
Using the mathematical formulas to calculate the Greeks is not practical due to the volume of trades a trader must consider. Thankfully many brokers provide that information on their trading platforms.
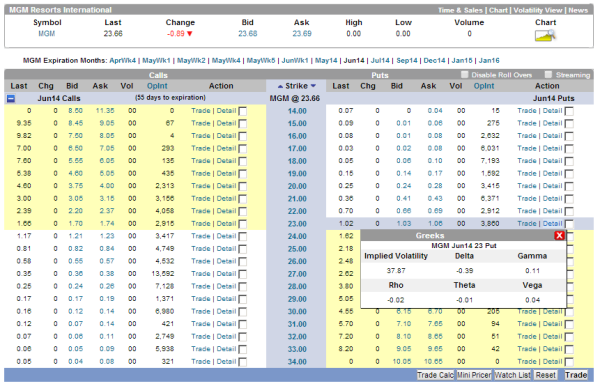
With the above figure you can see how delta on call options is represented in the positive figures between zero and one.
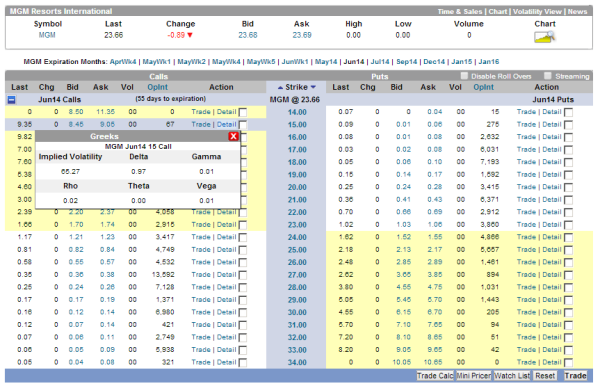
As an option moves further in the money so the price of the premium increases. The above example shows the in-the-money call option at the strike $15 has a delta of 0.97. So theoretically if the price of the underlying stock moves a further $1, the premium can move almost dollar for dollar. In this case it is $97 over 1 contract of 100 shares. Far out-of-the-money options have deltas close to zero, whereas those deep-in-the-money as in the above example have deltas closer to one.
Delta will change accordingly to expiry. For in-the-money options they will increase, whereas those that are out-of-money will decrease.
If volatility rises, the time value of the option increases. With delta, out-of-the-money options increase, and in-the-money decrease, when markets become more volatile.
Gamma relates to delta by measuring the rate of change for each one-point increase in the underlying derivative. It helps a trader anticipate any change of the delta of an option.
It’s larger for at-the-money options, and then lowers the further the prices go out or in-the-money. Gamma is always positive in measuring calls and puts and is expressed as a percentage, reflecting the change in the delta and how it responds to a one point movement in the underlying stock.
Gamma will increase in value as the strike price of the underlying stock goes closer to the at-the-money position. It will decrease as it moves further out-of or in-the-money.
Time expiry also has the same effect on gamma for at-the-money options. Gamma will increase as time to expiry approaches for at-the-money options, but decrease for out-of-the-money and in-the-money positions.
Gamma is high when volatility is low for at-the-money options, but for deep out-of-the-money and in-the-money options it is low.
Theta measures the time decay of an option. It shows the dollar amount an option loses each day as it approaches expiry. As it gets closer to expiry it will increase for at-the-money options whereas it decreases for in and out-of-the-money options. Remember the further an option is from expiry the greater it’s time value. It is usually presented as a negative number and reveals the amount the option will decrease each day.
So a $1 option with a theta of .05 will decrease by 5c every day and be worth .90 in two days’ time.
An option with a long expiry will have a theta close to zero as they don’t lose value as much each day. Conversely one close to expiry especially at-the-money will have a high theta, as it will lose most value as it marches towards expiry.
Theta on highly volatile stocks is higher than low volatile stocks. This reflects the higher time value on options over these stocks and the fact they have more to lose.
Vega measures the sensitivity of the price of an option to changes in volatility. Now it doesn’t measure volatility. Volatility relates to the underlying asset itself. Vega relates to the sensitivity of the option. Changes in volatility directly affect both calls and puts with increases in the option prices. However, each option has its own vega, and will respond differently even for options over the same underlying asset. As a general comment vega seems to affect calls more than puts.
Vega will reflect a 1% change in the value of the underlying stock. Options premiums tend to go up when things become more volatile, and fall when the market swings less. Vega is added when volatility goes up, and subtracted when volatility is reduced.
Length of time to expiry increases in vega as the risk exposure is longer in time before the close of contract.
In my personal trading when using the Greeks my focus is mostly on Delta. Anticipating a potential price change if a trade goes against me and by how much is beneficial. It allows you to get a feel for the risk vs reward. This is on the basic understanding that the measurement is different for each option and/or underlying derivative or stock.
Jim Graham in his article “Using ‘The Greeks’ To Understand Options”, (July 01 2010) writes, “It is not enough to just know the total capital at risk in an options position. To understand the probability of a trade making money, it is essential to be able to determine a variety of risk-exposure measurements.”
BETA
While the Greeks are fantastic for measuring the prices fluctuations of an individual option and how they relate to the underlying security and stock, beta allows us to go broader in its measurements.
Beta is often used to look closely at the volatility of a security and its risk compared to the whole market. This allows a trader to get a feel for how a particular stock behaves as compared to another, and determines whether its volatility is suited to their trading style.
Beta is used in the capital asset pricing model (CAPM). This calculates “the expected return of an asset based on its beta and expected market returns.” (investepdia.com)
What beta does is look at how a stock or security responds to swings and trends in the market as a whole, such as the S&P 500.
Number “1” is the point of reference of where and how the market moves. Betas to individual stocks are then measured against this reference point.
So if a stock is also one it is interpreted that it’s fluctuation moves in relation to the market.
If it is below one it indicates that their price fluctuations are less than the general market, and it is less volatile. If it is higher than one it indicates its price fluctuations are greater than the market, and it is therefore more volatile. If a stock’s beta is 1.5 it is considered theoretically to be 50% more volatile than how the market moves. Typically energy stocks often fall in this category. Conversely, a stock beta of 0.6 theoretically means the stock is 40% less volatile than the market. Again as a general observation bank stocks often have betas less than one as they tend to move more conservatively than the market.
So as a general comment the higher the beta is, the higher the volatility of the stock; and the higher the premiums of the option prices are to reflect that risk.
Conversely, the lower the beta is, the less volatility of the stock, and the lower the premiums of the options prices are to reflect that risk.
For those traders more risk adverse, in many instances trying to find options on stocks with very low beta and little time to expiry may be difficult to find profitable to trade, as there’s just not enough ‘bang for buck’ to make the transaction worth their while.
At the other extreme more aggressive traders may enjoy higher premiums on stocks with higher beta but they may incur greater losses if the trade goes against them. There’s a reason the premiums are higher!
Additionally, it’s important to bear in mind that beta measures historical performance. In other words it doesn’t necessarily mean that the stock or security will perform this way in the future, neither does it mean that the beta will always be the same. Beta moves in relation to the stock movement as it trades.
Beta for a trader is very helpful when considering whether they should trade a particular stock, especially if they are unfamiliar with it. Additionally, it is useful to compare what beta was historically to what it is now, as this can show if the stock has changed in its volatility. A trader may want to adjust how they trade that current stock if they discover it has changed.
 Beta can also help identify diversity in a portfolio. A trader may get a variety of stocks with different betas to create a more balanced portfolio. A combination of beta stock above and below one can also be a benchmark indicating which trades are more aggressive, and which stocks are more conservative.
It may also help develop criteria as to where they may choose to place an option strike price point in relation to the current stock price. A higher beta may indicate more caution is needed if a sold leg or liability is being traded. A trader may then decide more buffer is needed between the option strike they’re selling at compared to the current stock price. Conversely, a lower beta may require them to sell closer to the money or at-the-money to make the trade profitable. (This area is covered further in Course 4 – Subject 2 – Watch lists & Tiers.)
As with most indicators Beta is a mathematical equation.
HOW TO SOURCE THESE MEASUREMENTS & APPLY THEM
It’s one thing to be aware that something exists, and it’s another to be able to find and utilise it.
Obviously a good broker platform provides many measurements like the ‘Greeks’.
With the broker I use, (OptionsXpress), it is simply a matter of running your cursor over the options chain (detail buttons) and the information appears.
However some measurements are harder to find. For beta I tend to use independent resources from the broker such as Google Finance (www.google.com/finance) for the US markets, and Yahoo Finance ( finance.yahoo.com ). Other traders also look to Bloomberg and Reuters.
However in doing this you need to be aware of one of the weaknesses of Beta.
Below are the same charts taken on the same day for the same stock. Google Finances showed a Beta of 1.53, while Yahoo showed a Beta of 0.49!
For a trader this is confusing. Which one do you believe? Is the stock more or less volatile than the rest of the market measured at 1?
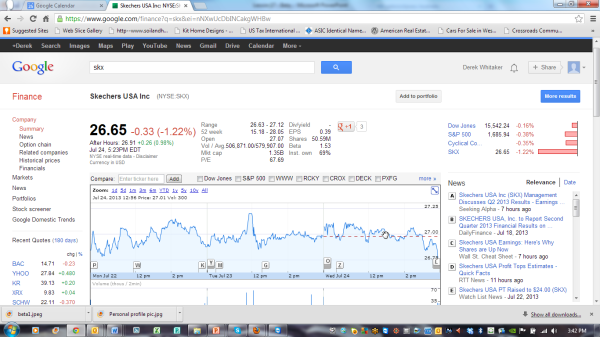
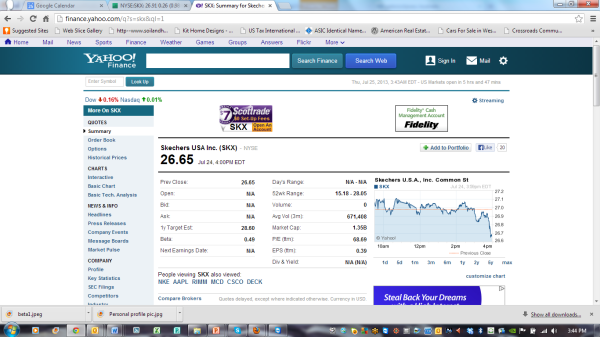
Why is this so? Well beta is a mathematical equation. It is done through regression analysis.
The difficulty is that it can be calculated a number of ways. One of the main formulas is Beta = Covariance (stock versus market returns) / Variance of the Stock Market.
The weakness is that different data providers look over different time periods. Bloomberg and Reuters are reported as good suppliers, but there is no right or wrong answer as to the time period.
Additionally, another weakness of beta is that is historical. A trader cannot assume that a stock with a beta of 2 is going to outperform the rest of the market when it is bullish. Historical performance is not an indicator of future performance.
Additionally, beta doesn’t measure against the sector, just the rest of the market like the S&P 500. There can be an anomaly in that sector ranging from government policy changing, through to slowing in a major economic country. Beta cannot measure this.
The advantage of beta is it’s a guide in identifying a stocks volatility compared to the market. So if the market is very volatile a beta calculation can be a quick comparison as to how that security MAY perform.
A combination of volatility measurements and Greeks can assist in risk vs reward assessment for a trader. Greeks and especially delta theoretically show what an option premium will cost if it goes against them. Beta shows the volatility compared to the rest of the market. Both have strengths and weaknesses, but they certainly aid in technical assessment of a trade and research.
REFERENCES:
Jim Graham, “Using “The Greeks” To Understand Options, (July 01 2010)
Source: http://www.investopedia.com/articles/optioninvestor/04/121604.asp#axzz1uvisyuPC
Investopedia
http://www.investopedia.com/articles/financial-theory/09/calculating-beta.asp
http://www.investopedia.com/articles/optioninvestor/04/121604.asp#axzz1uvisyuPC
Money Week Tutorials
https://www.youtube.com/watch?v=etlv7qTQUSY
The Options Guide
http://www.theoptionsguide.com/delta.aspx
OptionsXpress
www.optionsxpress.com.au